Pseudobulk expression profiles are used for differential expression analyses between test and control groups.
💡
Pseudobulk performs better than other methods in benchmarks.
💡
For samples comparison, genes are sorted by pseudobulk differential expression p-values. This compares the selected cluster between test and control samples.
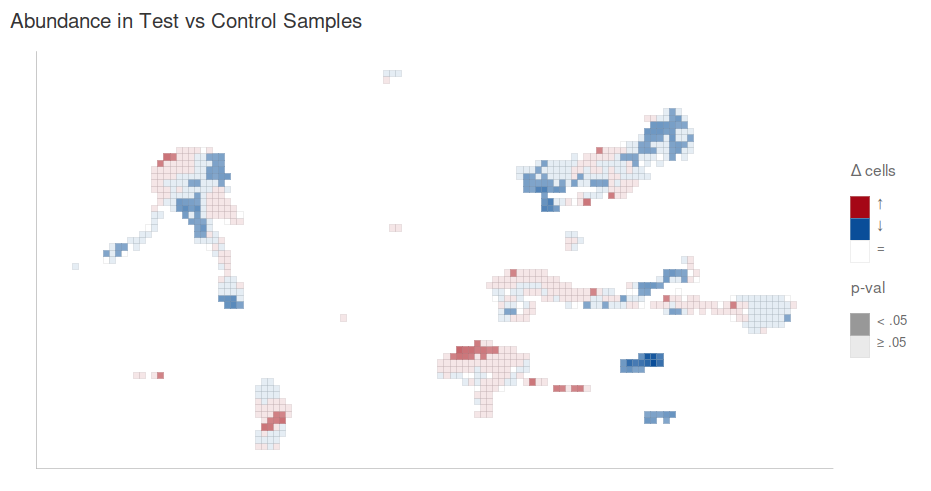
A differential abundance analysis is included in the downloaded results for any cluster. A grid-based differential abundance plot also allows you to visualize regions of differential abundance:
💡
The grid-based differential abundance defines clusters by projecting a grid over the embedding but is otherwise the same as the differential abundance analysis provided with downloaded results.
Dseqr runs Gene Ontology over-representation analysis of significantly up- and down-regulated genes. This uses a cached adaptation of goana.
💡
Adaptations to goana:- Uses genes with FDR < 0.05 with a min of 50 up/down.- Uses expressed genes as a background (from edgeR::filterByExpr).- Removes terms with fewer than 4 up/down genes (too few).- Removes terms with more than 250 genes (too broad).- Removes terms with Δup-down < 3 genes per 10 (not distinctly up/down).- Removes terms with FDR > 0.05 (not significant).- Removes terms with FDR < 0.05 for both up/down (not distinctly up/down)
💡
Terms are grouped if their set of up/down genes have a jaccard similarity > 0.7 (smallest FDR is parent).
💡
The Genes column in the GO csv can be pasted into the gene search box to explore up/down genes for a term.
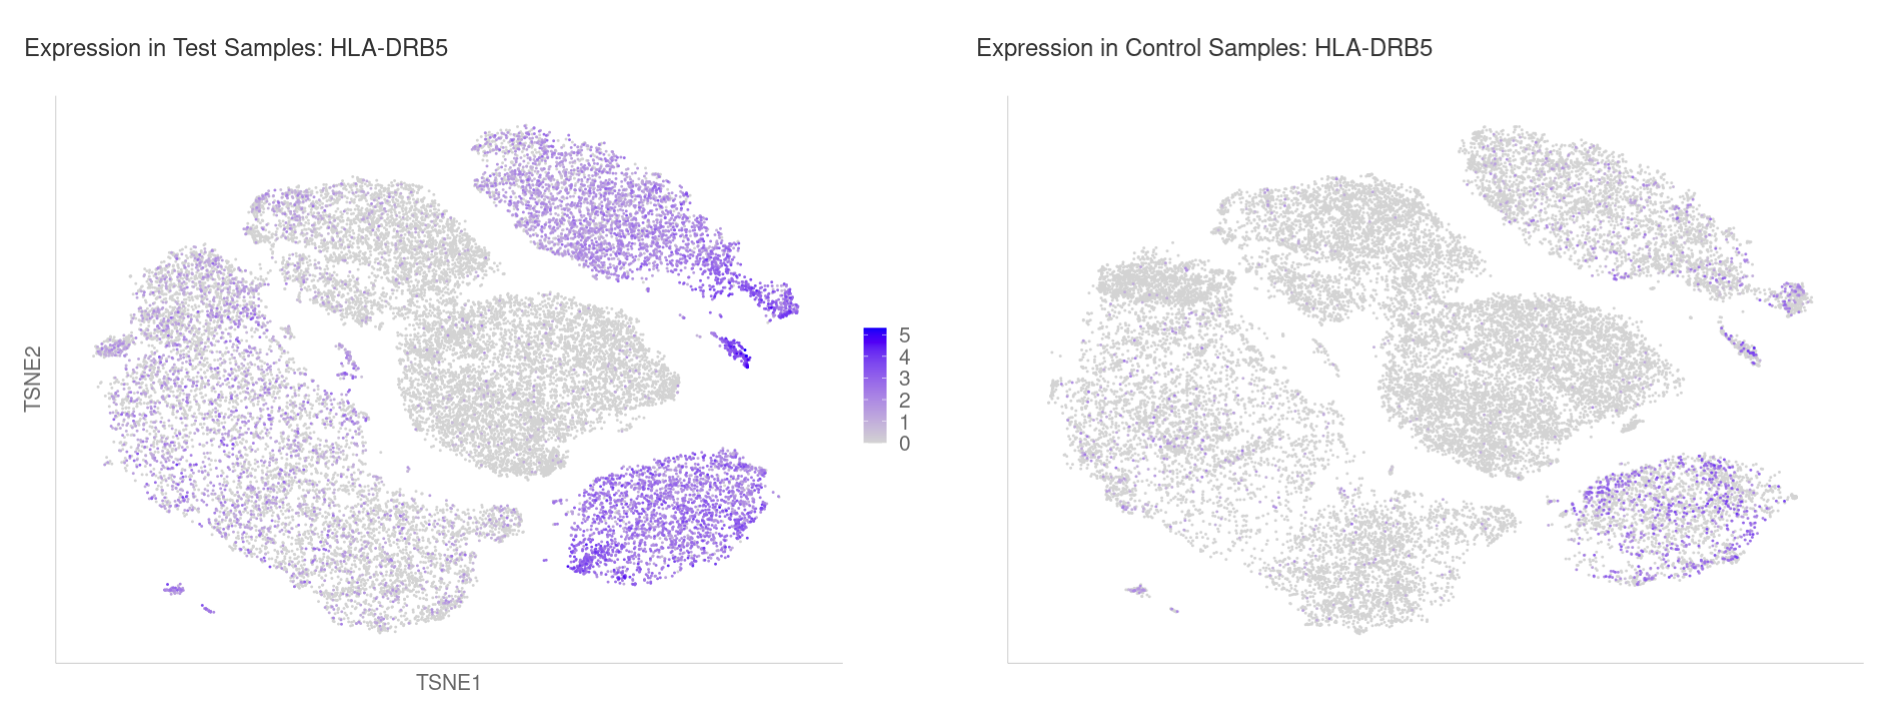
With samples comparison, select a gene to see expression side-by-side in test and control cells:
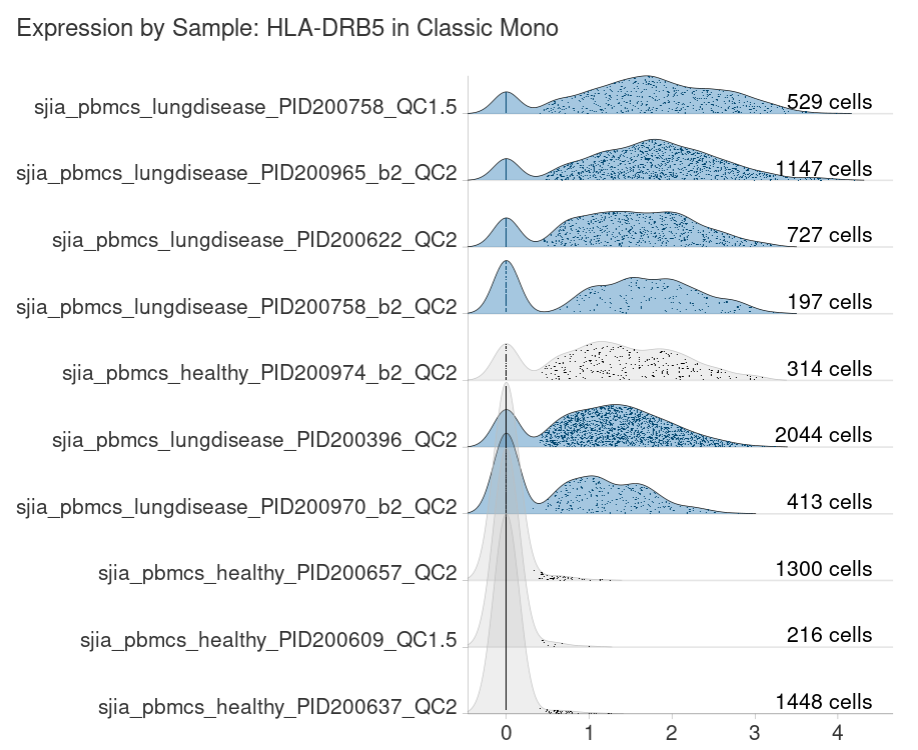
You are also shown the distribution of logcounts across each sample for the selected cluster:
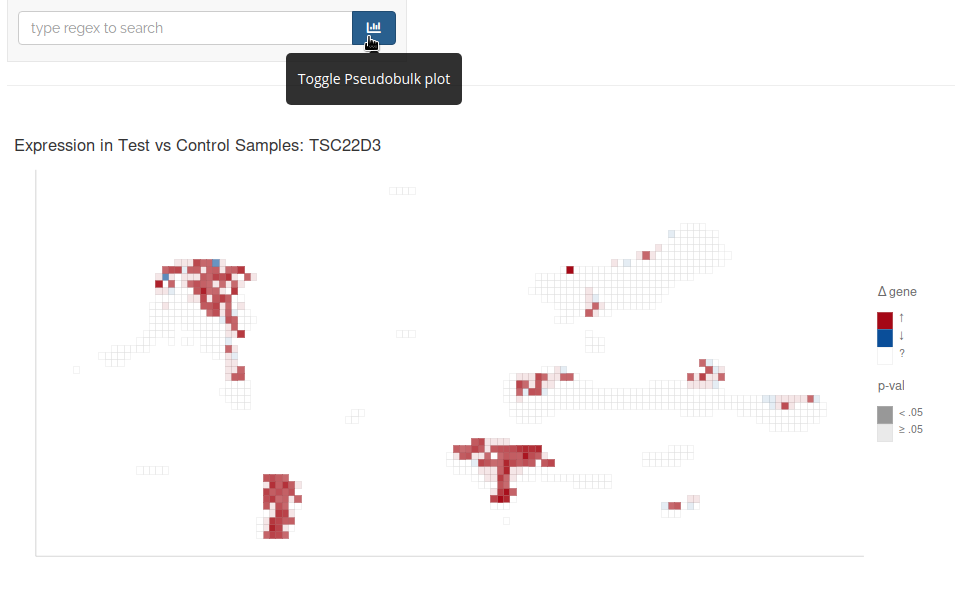
You can also toggle the pseudobulk plot button to visualize regions of differential expression for the selected gene:
💡
Grid-based differential expression defines clusters by projecting a grid over the embedding but is otherwise similar to the cluster-based pseudobulk differential expression analyses.
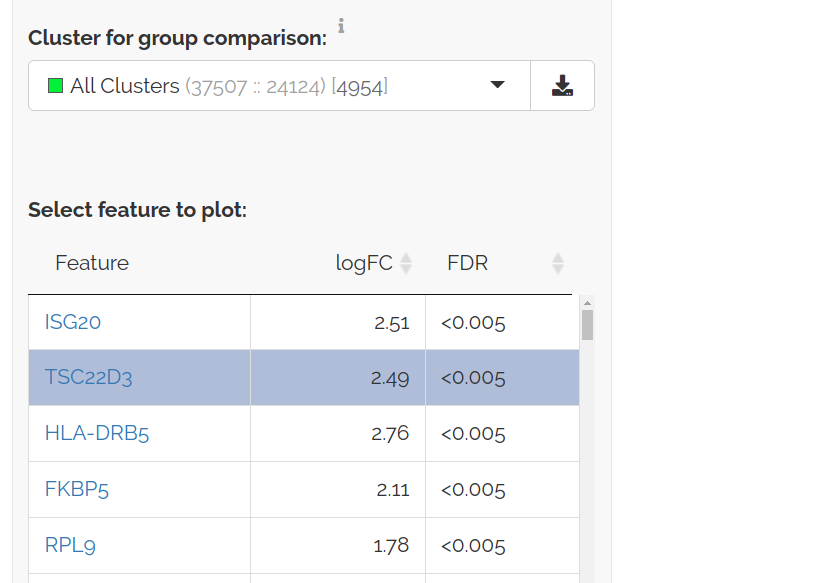
To view genes that are consistently differentially expressed across clusters select All Clusters:
💡
logFC for all clusters is calculated with an effect size meta-analysis on the differential expression analyses between test and control samples for each cluster.FDRs are similarly calculated with a p-value based meta-analysis using Stouffer's method followed by adjustment for multiple hypothesis testing.