Differential Analyses
Run expression and pathway analyses between test and control samples.
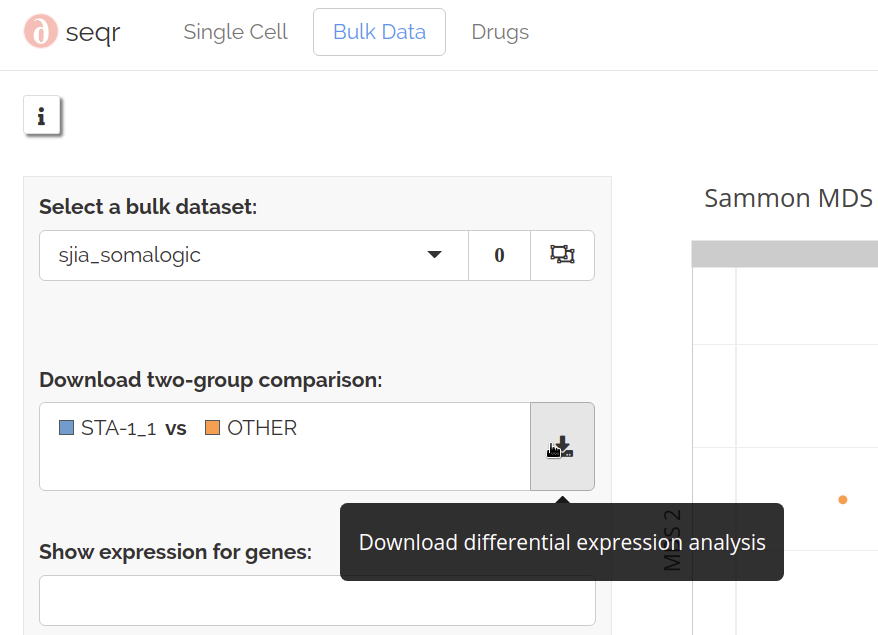
Download analyses
To run differential expression and pathway analyses, first select a test group followed by a control group. Then click the download button:
Pathway analyses
Dseqr runs Gene Ontology over-representation analysis of significantly up- and down-regulated genes. This uses a cached adaptation of goana.
Adaptations to goana:- Uses genes with FDR < 0.05 with a min of 50 up/down.- Uses expressed genes as a background (from edgeR::filterByExpr).- Removes terms with fewer than 4 up/down genes (too few).- Removes terms with more than 250 genes (too broad).- Removes terms with Δup-down < 3 genes per 10 (not distinctly up/down).- Removes terms with FDR > 0.05 (not significant).- Removes terms with FDR < 0.05 for both up/down (not distinctly up/down)
Terms are grouped if their set of up/down genes have a jaccard similarity > 0.7 (smallest FDR is parent).
Surrogate variable analysis
Discovered surrogate variables can be optionally included as covariates for differential expression analyses:

MDS plots
Multi-dimensional scaling plots are shown for both non-adjusted and adjusted data:
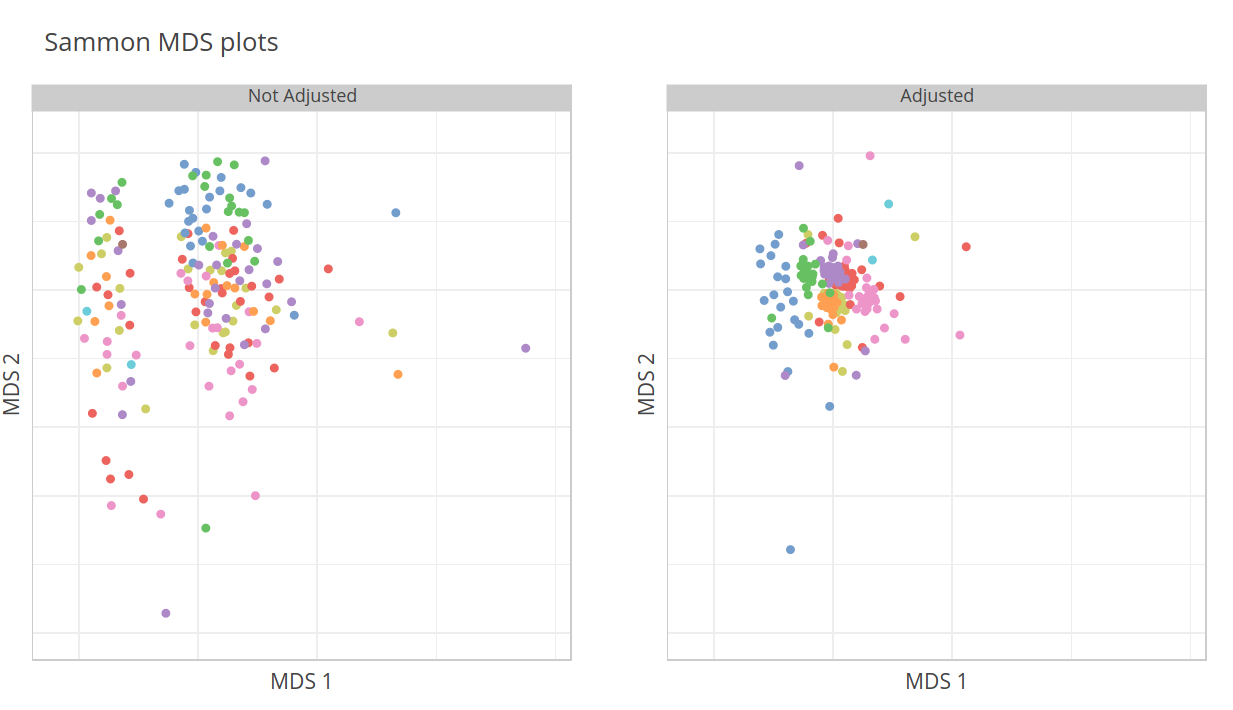
Adjusted logcounts are computed by regressing out Pairs and surrogate variables.
Adjusted logcounts are used only for MDS visualization. For differential expression analyses, Pairs and surrogate variables are used as covariates with non-adjusted logcounts.
Gene plots
Viewing raw logcounts for a gene can be a useful addition to summary statistics. To show logcounts for a gene of interest summarized by groups, select a gene to show expression for:
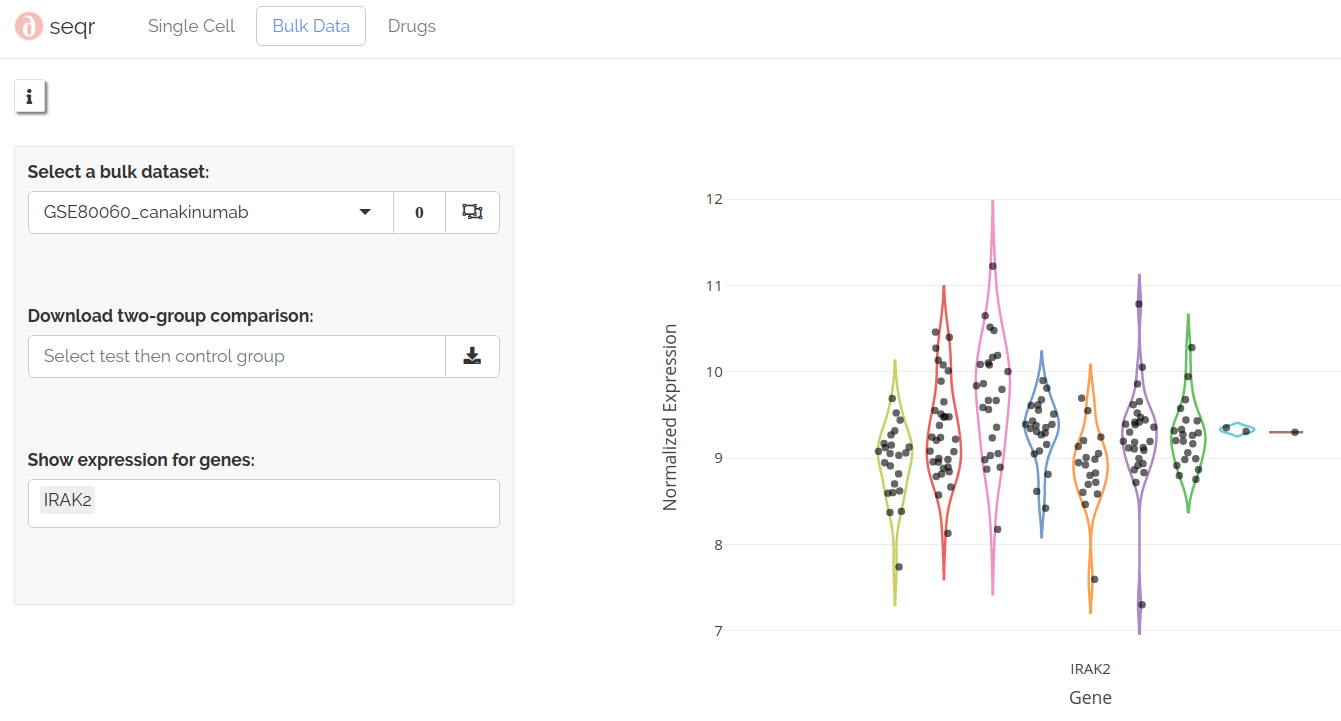
Gene plots use non-adjusted logcounts.